Additional Files
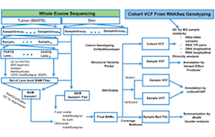
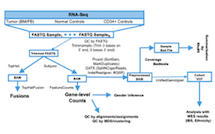
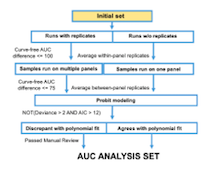
Whole Exome Sequencing, RNA-Sequencing, and Drug Sensitivity Data Analysis Workflows.
A. The workflow and analytical pipelines for computational analysis of whole exome sequencing, gene fusion calling, quality control, and gene expression count summarization are shown. (861 KB)
B. The workflow and analytical pipelines for computational analysis of RNA-sequencing, variant calling, quality control, and variant summarization are shown. (619 KB)
C. The workflow and analytical pipelines for analysis of drug sensitivity curve fitting, quality control, and final AUC summarization are shown. (463 KB)
Integration of Genetic Events with Drug Sensitivity.
Whole cohort
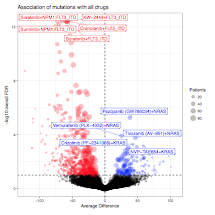
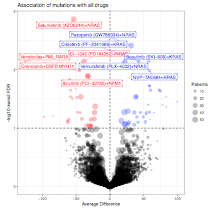
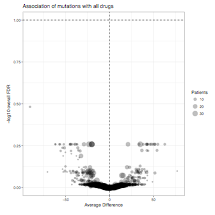
All mutational and cytogenetic events where at least 5 patient samples with evaluable drug sensitivity data exhibited mutation of the gene were assessed for average difference in area under the curve between mutant and wild type samples. A statistical comparison of the mutant versus wild type drug sensitivity patterns (corrected for multiple comparisons) was also computed. Average difference between mutant and wild type cases is plotted on the horizontal axis with FDR-corrected q-value plotted on the vertical axis. (3.5 MB)
All mutational and cytogenetic events where at least 5 patient samples with evaluable drug sensitivity data exhibited mutation of the gene were assessed for average difference in area under the curve between mutant and wild type samples. A statistical comparison of the mutant versus wild type drug sensitivity patterns (corrected for multiple comparisons) was also computed. Average difference between mutant and wild type cases is plotted on the horizontal axis with FDR-corrected q-value plotted on the vertical axis. (3.5 MB)
FLT3 WT only
All mutational and cytogenetic events where at least 5 patient samples with evaluable drug sensitivity data exhibited mutation of the gene were assessed for average difference in area under the curve between mutant and wild type samples. A statistical comparison of the mutant versus wild type drug sensitivity patterns (corrected for multiple comparisons) was also computed. Average difference between mutant and wild type cases is plotted on the horizontal axis with FDR-corrected q-value plotted on the vertical axis. (2.2 MB)
All mutational and cytogenetic events where at least 5 patient samples with evaluable drug sensitivity data exhibited mutation of the gene were assessed for average difference in area under the curve between mutant and wild type samples. A statistical comparison of the mutant versus wild type drug sensitivity patterns (corrected for multiple comparisons) was also computed. Average difference between mutant and wild type cases is plotted on the horizontal axis with FDR-corrected q-value plotted on the vertical axis. (2.2 MB)
FLT3 mutant cases only
All mutational and cytogenetic events where at least 5 patient samples with evaluable drug sensitivity data exhibited mutation of the gene were assessed for average difference in area under the curve between mutant and wild type samples. A statistical comparison of the mutant versus wild type drug sensitivity patterns (corrected for multiple comparisons) was also computed. Average difference between mutant and wild type cases is plotted on the horizontal axis with FDR-corrected q-value plotted on the vertical axis. (629 KB)
All mutational and cytogenetic events where at least 5 patient samples with evaluable drug sensitivity data exhibited mutation of the gene were assessed for average difference in area under the curve between mutant and wild type samples. A statistical comparison of the mutant versus wild type drug sensitivity patterns (corrected for multiple comparisons) was also computed. Average difference between mutant and wild type cases is plotted on the horizontal axis with FDR-corrected q-value plotted on the vertical axis. (629 KB)
Heatmaps for the remaining drug sensitivity expression signatures
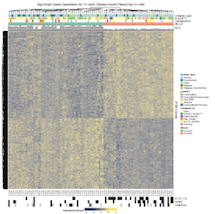
The individual genes that were most significantly expressed between sensitive and resistant specimens are shown with major clinical and genetic parameters of each case as well as the area under the curve values annotated. (42.3 MB)
The individual genes that were most significantly expressed between sensitive and resistant specimens are shown with major clinical and genetic parameters of each case as well as the area under the curve values annotated. (42.3 MB)
Concordance drug families per sample
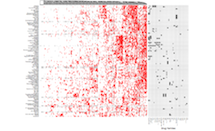
A heatmap of binary sensitive/resistant calls for each sample to each drug shows a global view of overall sensitivity or resistance of each sample. (164 KB)
A heatmap of binary sensitive/resistant calls for each sample to each drug shows a global view of overall sensitivity or resistance of each sample. (164 KB)
Lasso regression of drug families
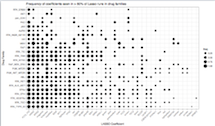
The Lasso regression was performed for all inhibitors on the panel. Drugs were then summarized by their families and the number of drugs within a given family where a given mutational event or gene expression cluster was observed in greater than 50% Lasso runs was recorded. Circle size represents the proportion relative to the total family size. (10 KB)
The Lasso regression was performed for all inhibitors on the panel. Drugs were then summarized by their families and the number of drugs within a given family where a given mutational event or gene expression cluster was observed in greater than 50% Lasso runs was recorded. Circle size represents the proportion relative to the total family size. (10 KB)
