No data found.

Data
The data was collated from featureCounts matrices derived from the subjunc alignments and all genes with no counts across the samples were excluded. Genes with duplicate gene symbols and those where the counts were < 10 for 90% or more of the samples were additionally removed prior to normalization.
Normalization was performed using the conditional quantile normalization procedure which produced GC-content corrected log2 reads per kilobase per million mapped reads (RPKM) values. Note batch correction was not performed at this time as the known technical variables clustered fairly randomly for both hierarchical clustering of the top 2,000 most variable genes as well as in an MDS plot of the top 500 genes.
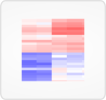
Genes are first ranked by the variance of the resulting normalized expression across samples. They are then centered and scaled across samples prior to clustering. The top 500 genes with highest variance are displayed in this view, clustered by gene and sample.
Clinical data can be added as the first rows of the plot.
Global sample-based filters affect this view. Any sample-based filters set here determine what samples (and therefore what genes) are included in this view. If no sample-based global filters are set, all are shown.
Note: if a global sample group comparison is active, the groups are annotated in the expression results, but the results are not clustered according to the groups.
Visuals
Expression values and clinical data are color-coded in tabular form.
User interactions
Drag a clinical data category to the container at right to add it to the plot. You may also expand categories by clicking on the "+", which will then allow you to drag over single values.
Clicking "Create plot" will initiate the ranking and clustering of genes and samples.
After the plot appears, click and drag over an area to display the genes and samples within. This will also allow you to download data just for those genes and samples in the selected area.
 Gene sets
 Mosaic
 Individual
 Compare
 Expression
 Cell Type
 Chronology
 Gene model
 Protein
 Inhibitor
 Hitwalker


